Study Notes · Part 1: Fundamental Concepts & OCV
Date: 2026-05-21
Task: Build an electrochemical battery simulation model from scratch in Python
Progress: SPM Single Particle Model · OCV Curves Complete
1. What Can Electrochemical Simulation Do?
Electrochemical simulation = creating a "digital twin" of a battery — using mathematical equations to simulate everything happening inside a battery on a computer.
| What You Want to Know | What Simulation Can Tell You |
|---|---|
| How much charge remains? | Simulate how voltage drops during discharge |
| How much current can it handle? | Simulate whether the battery interior "congests" under different currents |
| Why does the battery heat up? | Simulate internal losses → heat generation |
| How long will the battery last? | Simulate aging processes (cycle life) |
| How to design better batteries? | Adjust parameters and observe performance changes |
2. What Happens Inside a Li-ion Battery?
Three key steps during discharge:
graph LR
    A["Anode Particle<br/>Li → Li⁺ + e⁻"] -->|"Li⁺ through electrolyte"| B["Cathode Particle<br/>Li⁺ + e⁻ → Li"]
    A -->|"e⁻ through external circuit"| C["Work!<br/>Light the bulb"]
    C --> B
- Deintercalation: Lithium atoms at the anode particle surface lose electrons, becoming Li⁺ that enter the electrolyte
- Migration: Li⁺ travels through the electrolyte (separator) toward the cathode
- Intercalation: Li⁺ gains electrons at the cathode particle surface and embeds into the cathode
3. What is SPM (Single Particle Model)?
SPM = Single Particle Model, the simplest electrochemical battery model.
graph TD
    subgraph Real Battery
        A1["Particle Population<br/>Thousands of particles"]
        A2["Particle Population<br/>Thousands of particles"]
    end
    subgraph SPM Model
        B1["One sphere = Entire anode"]
        B2["One sphere = Entire cathode"]
    end
    A1 -.->|"Simplification"| B1
    A2 -.->|"Simplification"| B2
Three Core Assumptions of SPM
| Assumption | Meaning |
|---|---|
| (1) All particles behave identically | One sphere represents the entire electrode |
| (2) Neglect electrolyte concentration variations | Li⁺ concentration is uniform throughout the electrolyte |
| (3) Uniform current distribution | Each particle experiences the same current |
SPM Capability Boundaries
- Voltage–time curves (discharge/charge curves)
- Lithium concentration distribution within particles
- Battery performance under different currents
- SOC evolution over time
- Accurate prediction at high currents (neglects electrolyte gradients)
- Differences between particles at different positions
4. Parameter Naming Convention
Naming formula: self.{quantity}_{phase}_{position}
Quantity Prefixes
| Prefix | Meaning | Common Units |
|---|---|---|
L |
Length / Thickness | m |
R |
Radius or Ideal Gas Constant | m / J·mol⁻¹·K⁻¹ |
c |
Concentration | mol·m⁻³ |
D |
Diffusion Coefficient | m²·s⁻¹ |
eps |
Volume Fraction / Porosity | Dimensionless |
k |
Reaction Rate Constant | Context-dependent |
i |
Current Density | A·m⁻² |
F |
Faraday Constant | 96485 C·mol⁻¹ |
T |
Temperature | K |
Nr |
Number of Discrete Points | Dimensionless |
Phase Suffixes & Position Suffixes
| Suffix | Category | Meaning |
|---|---|---|
_s |
Phase | Solid Phase |
_e |
Phase | Electrolyte Phase |
_n |
Position | Negative Electrode |
_p |
Position | Positive Electrode |
_s |
Position | Separator |
Note:
_scan denote either "solid phase" or "separator" depending on context. For example,eps_s_n= negative solid-phase volume fraction,eps_e_s= separator electrolyte volume fraction.
Combination Examples
| Variable Name | Decomposition | Meaning |
|---|---|---|
c_s_max_n |
c + s + max + n | Maximum lithium concentration in negative solid phase |
D_s_p |
D + s + p | Positive solid-phase diffusion coefficient |
eps_e_s |
eps + e + s | Separator electrolyte volume fraction |
i_app |
i + app(applied) | Applied current density |
5. Cell SOC vs. Electrode SOC
Key Distinction
Cell SOC ≠ a given electrode's SOC. During discharge, the two electrodes evolve in opposite directions:
| Negative SOC | Positive SOC | |
|---|---|---|
| Cell 100% (Full) | 95% | 10% |
| Cell 0% (Empty) | 5% | ~79% |
| Direction (Discharge) | ↓ Decreasing | ↑ Increasing |
SOC Relationship Governed by Lithium Conservation
Moles of lithium lost by the anode = Moles of lithium gained by the cathode:
Key insight: This relationship is exactly linear — it is a direct consequence of mass conservation, not an approximation.
N/P Capacity Ratio
| N/P Value | Implication |
|---|---|
| > 1 | Anode capacity > Cathode capacity → Cathode is the limiting electrode during charge → Prevents lithium plating |
| < 1 | Cathode capacity > Anode capacity → Anode is the limiting electrode during discharge |
| Does not determine | Initial SOC pairing, but constrains how far discharge/charge can proceed |
Cell-Level SOC → Electrode SOC Automatic Conversion
In parameters.py, simply set battery_soc_initial = 0.3 (cell starts at 30%), and the program computes automatically.
graph TD
    A["battery_soc_initial = 0.3"] --> B["Endpoint Definition<br/>SOC_n_full=0.95, SOC_n_empty=0.05<br/>SOC_p_full=0.10"]
    B --> C["N/P Conservation<br/>SOC_p_empty = 0.10 + 0.90×(N/P)"]
    C --> D["Linear Interpolation<br/>SOC_n = 0.95 − 0.7×0.90 = 0.32<br/>SOC_p = 0.10 + 0.7×(N/P exchange rate)"]
    D --> E["Concentration Conversion<br/>c_init = SOC × c_max"]
6. OCV Curves (Open-Circuit Voltage)
OCV is the "fingerprint" of an electrode material — each material has a unique OCV–SOC relationship.
6.1 The Nernst Equation (Thermodynamic Foundation)
| Symbol | Name | Value | Meaning |
|---|---|---|---|
| \(U_0\) | Reference Potential | ~0.12 V (graphite) / ~3.85 V (NMC) | Characteristic potential of the material |
| \(R\) | Ideal Gas Constant | 8.314 J·mol⁻¹·K⁻¹ | |
| \(T\) | Temperature | 298.15 K | |
| \(F\) | Faraday Constant | 96485 C·mol⁻¹ | |
| \(RT/F\) | Thermal Voltage | 0.02569 V | The "thermal ruler" of one electron |
| \(\theta\) | Surface SOC | \(c_{s,\mathrm{surf}} / c_{s,\mathrm{max}}\) |
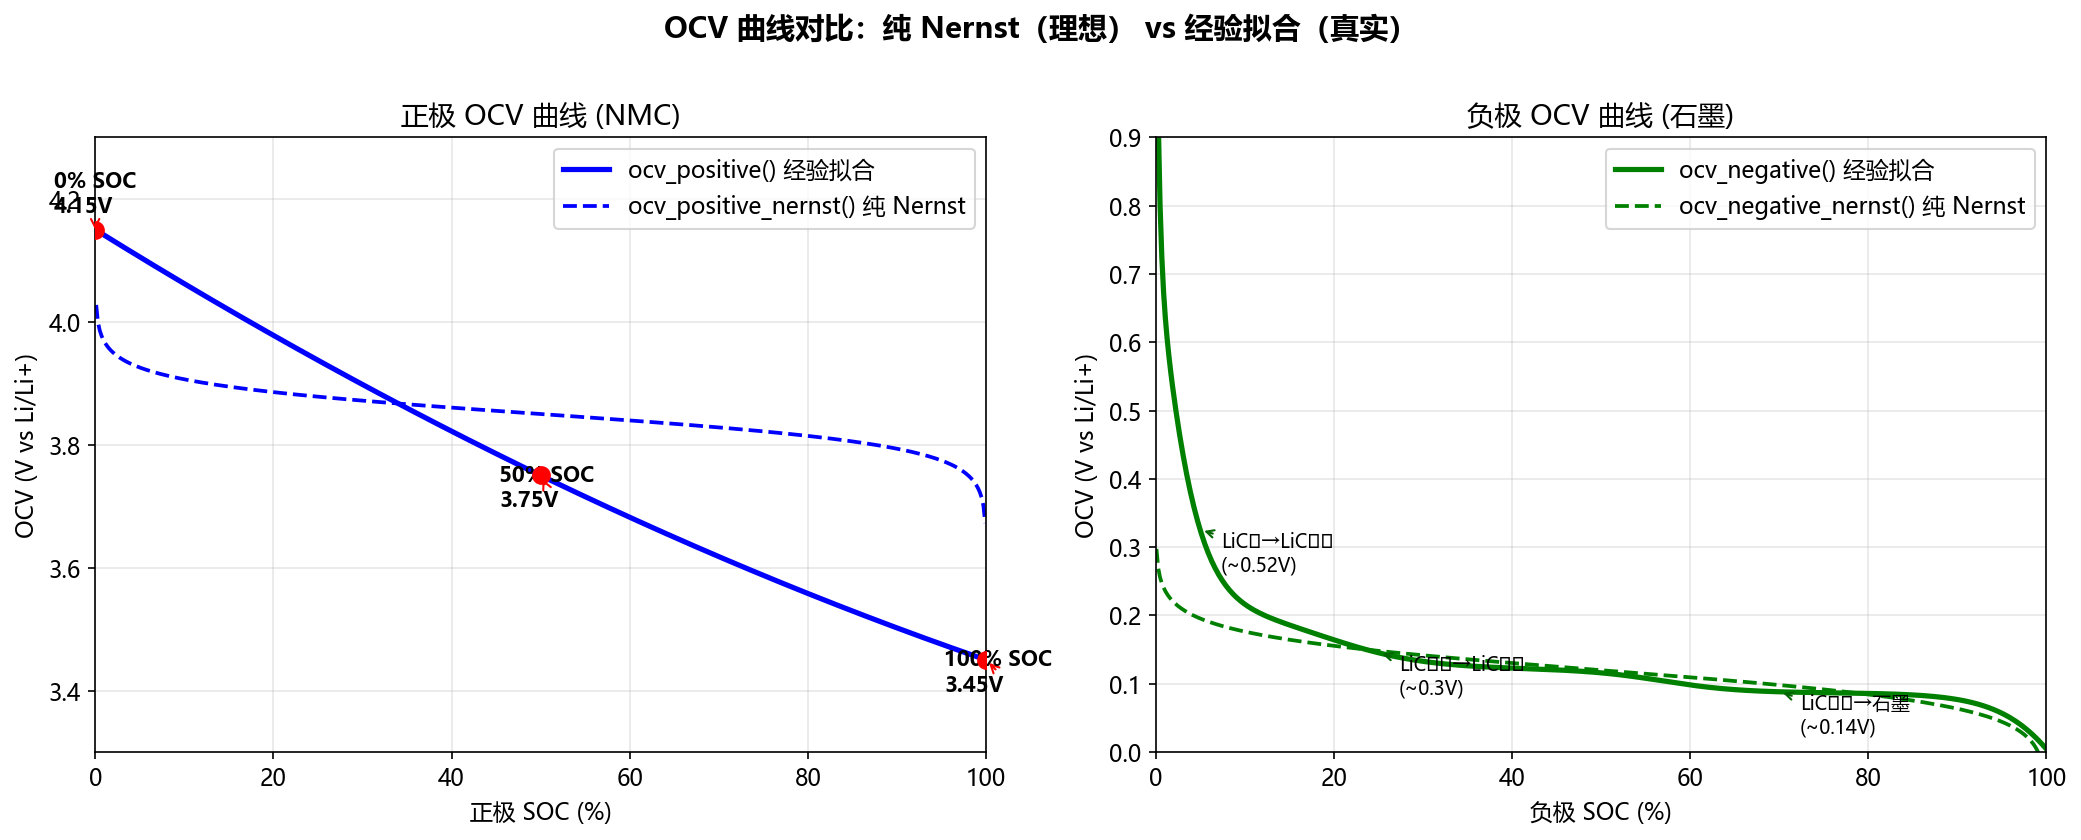
Physical Origin: The Nernst equation derives from the Gibbs free energy \(\Delta G = \Delta G_0 + RT \cdot \ln(\mathrm{activity\ ratio})\); it generates a complete curve with only 2 parameters. However, it assumes the material is an "ideal solution" — atoms do not interact with each other.
6.2 Ideal vs. Real
| Ideal Solution (Nernst) | Real Graphite | Real NMC | |
|---|---|---|---|
| Curve Shape | Smooth S-shape | Staircase plateaus | Smooth but asymmetric |
| Cause | No inter-atomic interactions | LiC₆→LiC₁₂→LiC₁₈ phase transitions | Multi-transition-metal synergy |
| Fitting Method | 2 parameters | Nernst + tanh steps | Nernst + polynomial |
6.3 Nernst Equation Breakdown
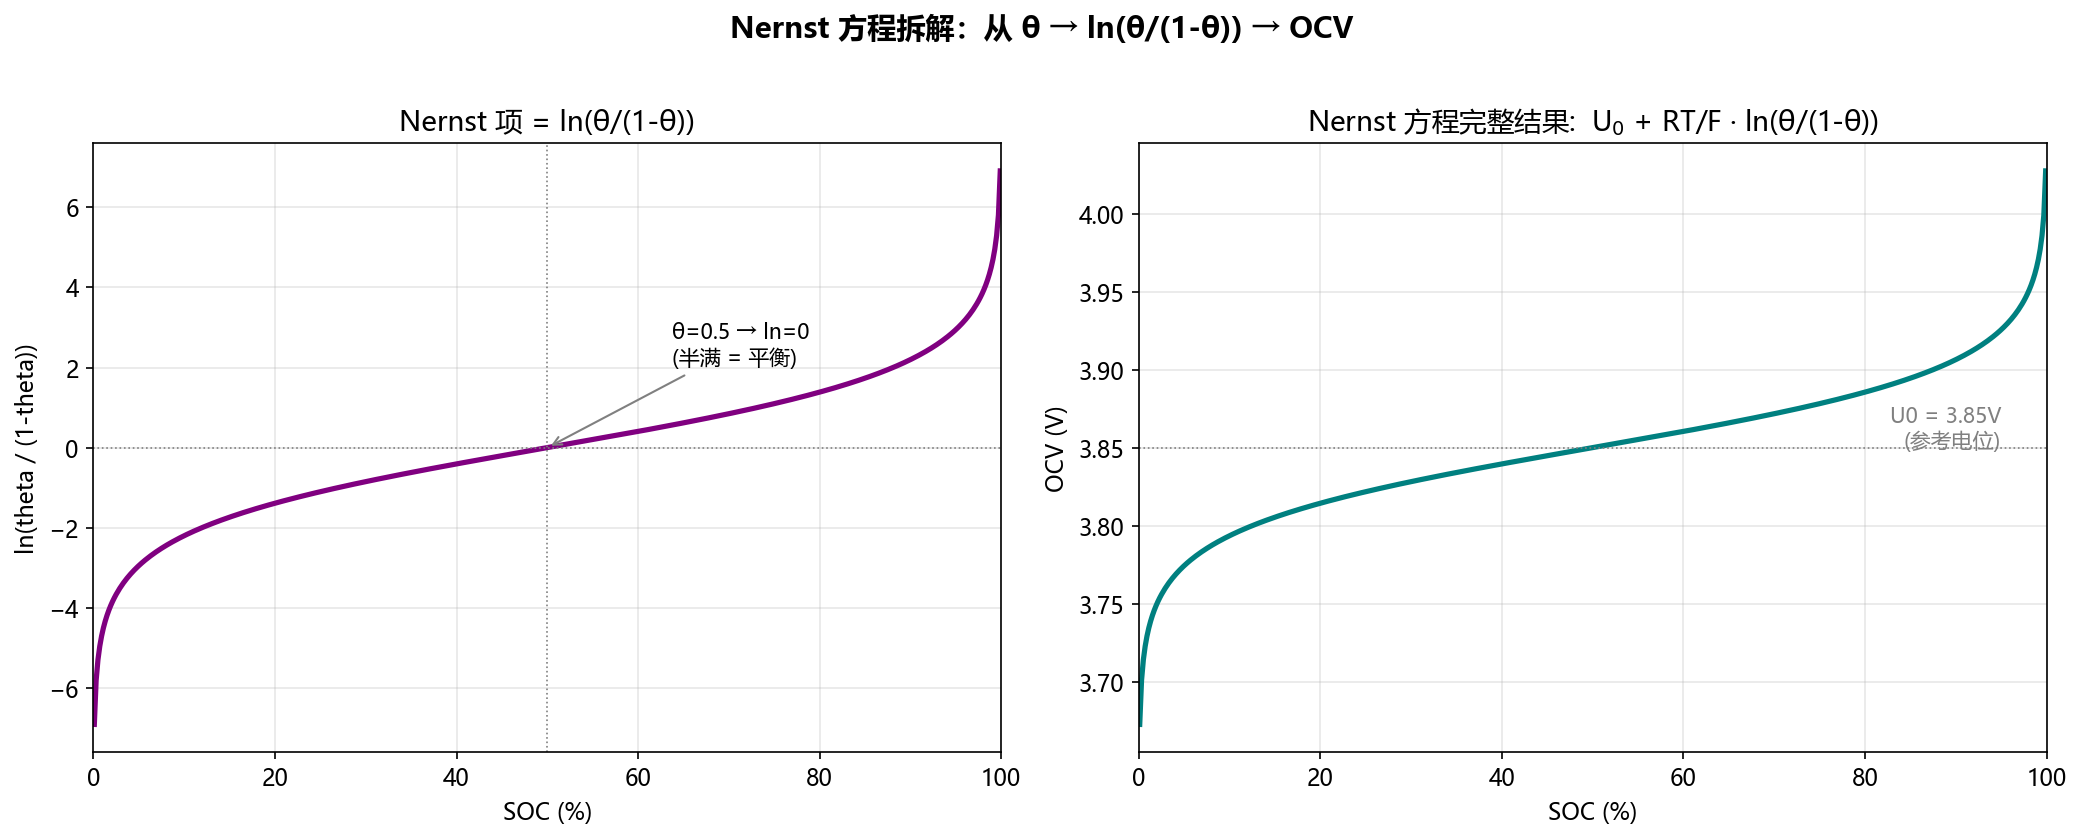
The core of Nernst is simply \(\ln(\theta/(1-\theta))\), multiplied by the thermal voltage \(RT/F \approx 0.026\mathrm{V}\):
- \(\theta = 0.5\): \(\ln(1) = 0\), \(OCV = U_0\) (equilibrium)
- \(\theta \to 0\): \(\ln \to -\infty\), OCV drops steeply
- \(\theta \to 1\): \(\ln \to +\infty\), OCV rises steeply
Key Insight: The "logarithmic scale" is compressed into the "millivolt scale" by the thermal voltage — the shape of the curve is entirely a mathematical expression of the entropy of mixing.
6.4 Graphite Anode OCV (ocv_negative)
def ocv_negative(theta):
    U = (0.6379                                          # baseline
         + 0.5416 * np.exp(-305.5309 * theta)             # exponential spike (θ<3%)
         - 0.0440 * np.tanh((theta - 0.1958) / 0.1088)    # tanh step 1 (~20%)
         - 0.1978 * np.tanh((theta - 1.0571) / 0.0854)    # tanh step 2 (~100% cliff)
         - 0.6875 * np.tanh((theta + 0.0117) / 0.0529)    # tanh step 3 (main step!)
         - 0.0175 * np.tanh((theta - 0.5692) / 0.0875))   # tanh step 4 (minor correction)
    return U
Essentially, mathematical "building blocks" (tanh smooth steps + exp spike) are used to approximate the staircase-like OCV produced by graphite phase transitions:
Each \(\tanh\) step corresponds to one phase-transition stage of graphite during lithiation/delithiation.
6.5 NMC Cathode OCV (ocv_positive)
def ocv_positive(theta):
    return 4.15 - 0.9 * theta + 0.2 * theta**2
| Control Point | OCV |
|---|---|
| \(\theta = 0\) | 4.15 V (fully delithiated, highest potential) |
| \(\theta = 0.5\) | 3.75 V (half-full) |
| \(\theta = 1\) | 3.45 V (fully lithiated, lowest potential) |
6.6 The Full Picture: Four-Term Superposition
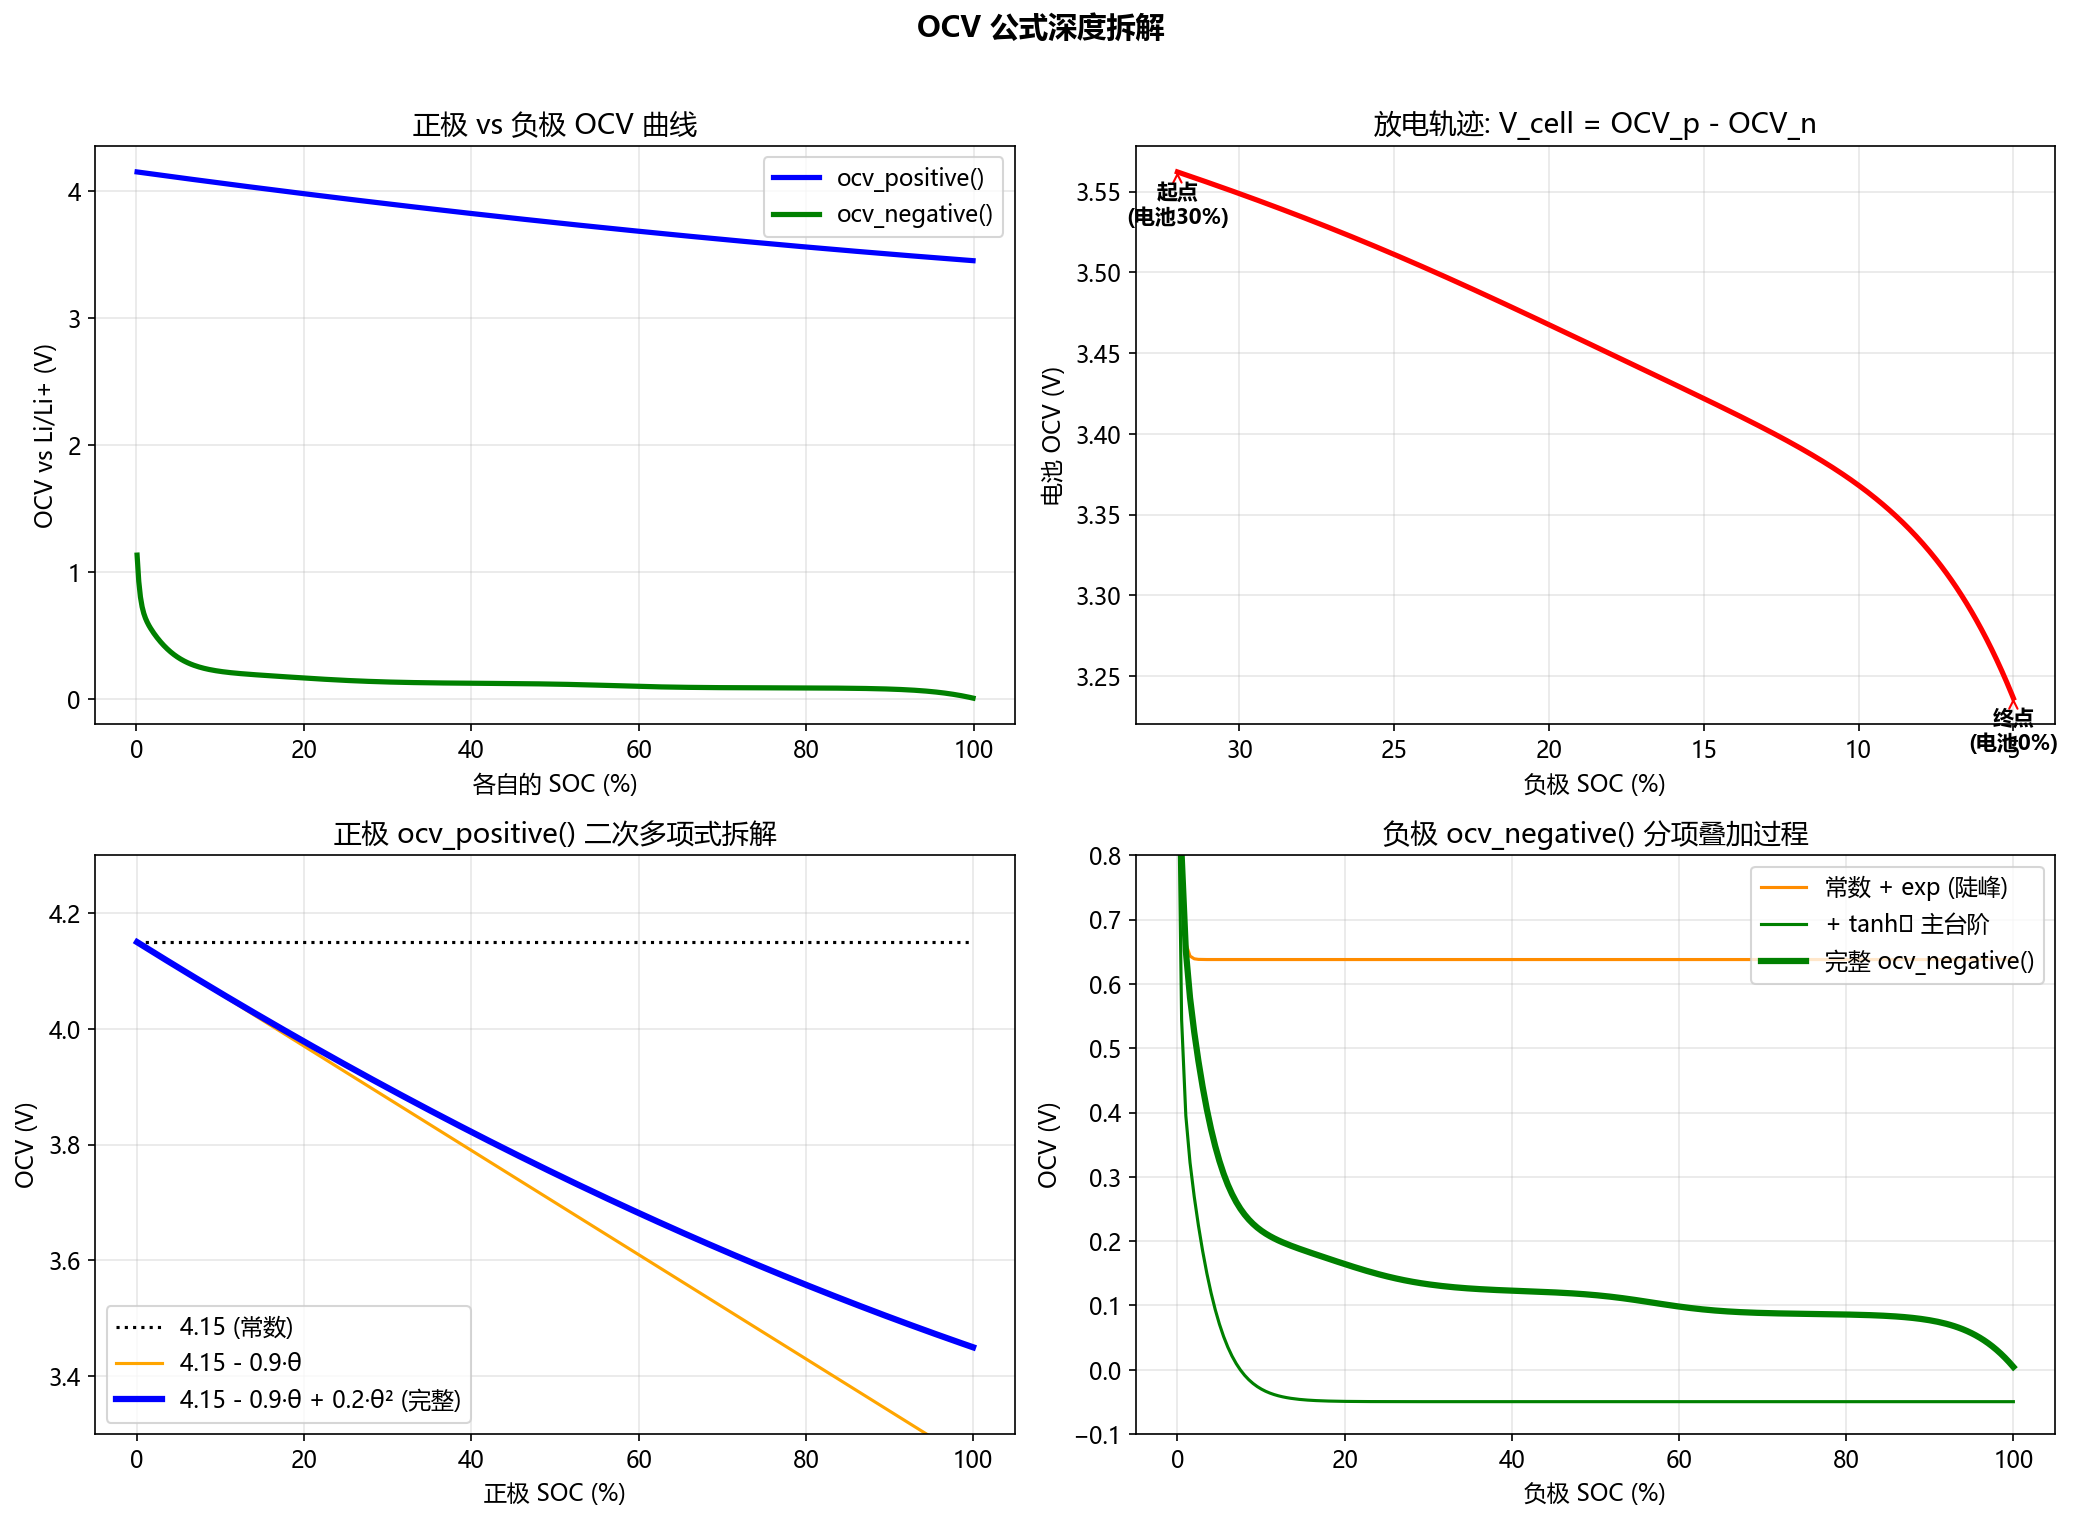
Focus on the upper-right subplot — this is the OCV trajectory when discharging from 30% SOC to 0%:
From ~3.65 V (start) down to ~3.45 V (end).
Note: This is only the OCV contribution; the overpotential \(\eta\) has not been included yet (adding \(\eta\) will depress the voltage further).
7. The Four OCV Functions at a Glance
| Function | Type | Purpose |
|---|---|---|
ocv_negative() |
Empirical Fit | Used at runtime, real graphite curve |
ocv_positive() |
Quadratic Polynomial | Used at runtime, real NMC curve |
ocv_negative_nernst() |
Pure Physics | Teaching use, comparing "ideal vs. real" |
ocv_positive_nernst() |
Pure Physics | Teaching use, comparing "ideal vs. real" |
8. The SPM Four-Equation Panorama
graph TD
    P["parameters.py<br/>Battery physical parameters"] --> M["model.py"]

    subgraph model.py
        direction TB
        O["(1) OCV Curves<br/>U(θ): Electrode material fingerprint"]
        D["(2) Diffusion Equation<br/>∂c/∂t = D/r²·∂/∂r(r²·∂c/∂r)"]
        B["(3) Butler-Volmer<br/>j ⇄ η: Interfacial reaction kinetics"]
        V["(4) Voltage Coupling<br/>V_cell = U_p+η_p − U_n−η_n"]
        O --> B
        D --> V
        B --> V
    end

    M --> R["simulate.py<br/>Run & plot analysis"]
9. Project File Structure
c:\Project\P2D\
├── requirements.txt                # numpy, scipy, matplotlib
├── visualize_ocv.py                # OCV visualization script
├── learning_notes_01_foundation.md  # Study notes
├── ocv_comparison.png              # Figure 1: Nernst vs. empirical fit
├── nernst_breakdown.png            # Figure 2: Nernst equation breakdown
├── ocv_deep_dive.png               # Figure 3: Four-term superposition + discharge trajectory
├── electro-ref/                    # Reference books
└── spm/
    ├── __init__.py
    ├── parameters.py               # Battery physical parameters + automatic SOC conversion
    ├── model.py                    # SPM core engine (4 governing equations)
    └── simulate.py                 # To be created
10. Key Formula Quick Reference
| Formula | Meaning |
|---|---|
| \(V_{\mathrm{cell}} = OCV_p - OCV_n\) | Cell open-circuit voltage = Cathode potential − Anode potential |
| \(\frac{\Delta SOC_p}{\Delta SOC_n} = \frac{N_{\mathrm{total}}}{P_{\mathrm{total}}}\) | SOC exchange rate (lithium conservation) |
| \(Q_{\mathrm{Ah}} = \frac{F \cdot \min(cap_n, cap_p)}{3600}\) | Cell capacity [Ah] |
| \(i_{1C} = \frac{Q_{\mathrm{Ah}}}{A}\) | 1C current density |
| \(j = \frac{i}{a_s \cdot L \cdot F}\) | Current density → reaction flux |
| \(a_s = \frac{3 \cdot \varepsilon_s}{R}\) | Active specific surface area (spherical particles) |
| \(OCV(\theta) = U_0 + \frac{RT}{F}\ln\!\left(\frac{\theta}{1-\theta}\right)\) | Nernst equation |
| \(OCV_{\mathrm{NMC}}(\theta) = 4.15 - 0.9\theta + 0.2\theta^2\) | NMC cathode OCV |
11. To-Do / Next Steps
- Understand SPM model concepts
- Master parameter naming rules and physical meanings
- Understand N/P ratio and SOC conversion
- Understand OCV curves (Nernst + empirical fitting)
- Study the diffusion equation (Fick's Second Law in spherical coordinates)
- Study Butler-Volmer kinetics
- Study voltage coupling
- Write
simulate.py, run a complete simulation - Plot discharge curves, analyze results
End of Notes · Next Part: Diffusion Equation & Butler-Volmer Kinetics